Analysis of the graph: From the graph it is clear that
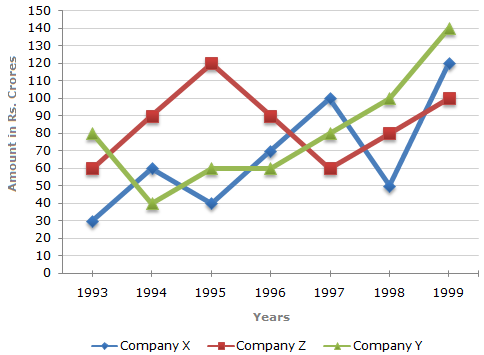
The amount of exports of Company X (in crore Rs.) in the years 1993, 1994, 1995, 1996, 1997, 1998 and 1999 are 30, 60, 40, 70, 100, 50 and 120 respectively.
The amount of exports of Company Y (in crore Rs.) in the years 1993, 1994, 1995, 1996, 1997, 1998 and 1999 are 80, 40, 60, 60, 80, 100 and 140 respectively.
The amount of exports of Company Z (in crore Rs.) in the years 1993, 1994, 1995, 1996, 1997, 1998 and 1999 are 60, 90,, 120, 90, 60, 80 and 100 respectively.
Average annual exports (in Rs. crore) of Company Y during the given period
=
1
x (80 + 40 + 60 + 60 + 80 + 100 + 140) =
560
= 80.
7
7
Average annual exports (in Rs. crore) of Company Z during the given period
Average annual exports of Company Z during the given period
=
1
x (60 + 90 + 120 + 90 + 60 + 80 + 100)
7
= Rs.
600
crores
7
= Rs. 85.71 crores.
From the analysis of graph the exports of Company Z are more than the average annual exports of Company Z (i.e., Rs. 85.71 crores) during the years 1994, 1995, 1996 and 1999, i.e., during 4 of the given years.


 Required percentage =
![]](/_files/images/data-interpretation/common/15-sym-cbracket-h3.gif)
 93.33%.
![]](/_files/images/data-interpretation/common/15-sym-cbracket-h1.gif)