
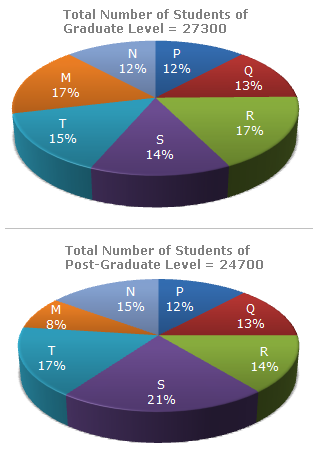
The following pie-charts show the distribution of students of graduate and post-graduate levels in seven different institutes in a town.
Distribution of students at graduate and post-graduate levels in seven institutes:
| 1. |
What is the total number of graduate and post-graduate level students is institute R? |
|||||||
|
| 2. |
What is the ratio between the number of students studying at post-graduate and graduate levels respectively from institute S? |
|||||||
|
| 3. |
How many students of institutes of M and S are studying at graduate level? |
|||||||
|
 Total number of students at graduate in institutes M and S
| 4. |
What is the ratio between the number of students studying at post-graduate level from institutes S and the number of students studying at graduate level from institute Q? |
|||||||
|
| 5. |
Total number of students studying at post-graduate level from institutes N and P is |
|||||||
|